The experimental work in our group is characterized by a large number of complementary dynamic measurement techniques, which are applied to different systems. Therefore, we constantly strive for an improved understanding of each method, to be able to successfully combine different techniques to open up complementary perspectives on the systems under study.

Picture: AG Blochowicz

Broadband dielectric spectroscopy (BDS)

BDS can be utilized to characterize a sample’s time-dependent response to an external electric field.

In case the oscillatory frequency of the electric field coincides with the resonance frequency of the molecules in the sample, one observes a decay in ε′(ν) and a peak in ε′′(ν).

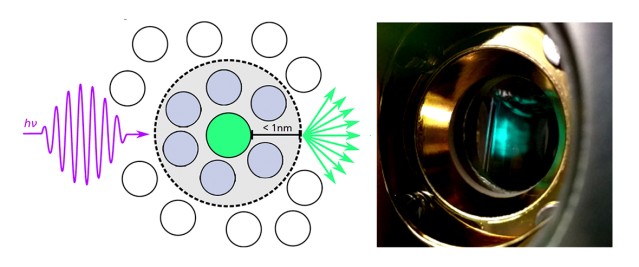
Since the macroscopic dielectric permittivity results from the superposition of all microscopic dipole moments of the molecules in a sample, information regarding molecular dynamics in e.g. simple molecular liquids or mixtures can be gained by analyzing BDS data.

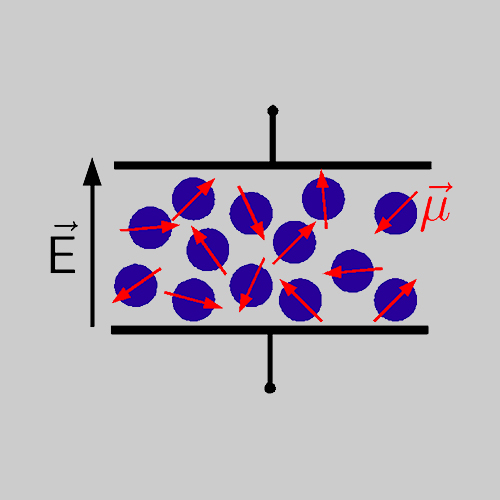
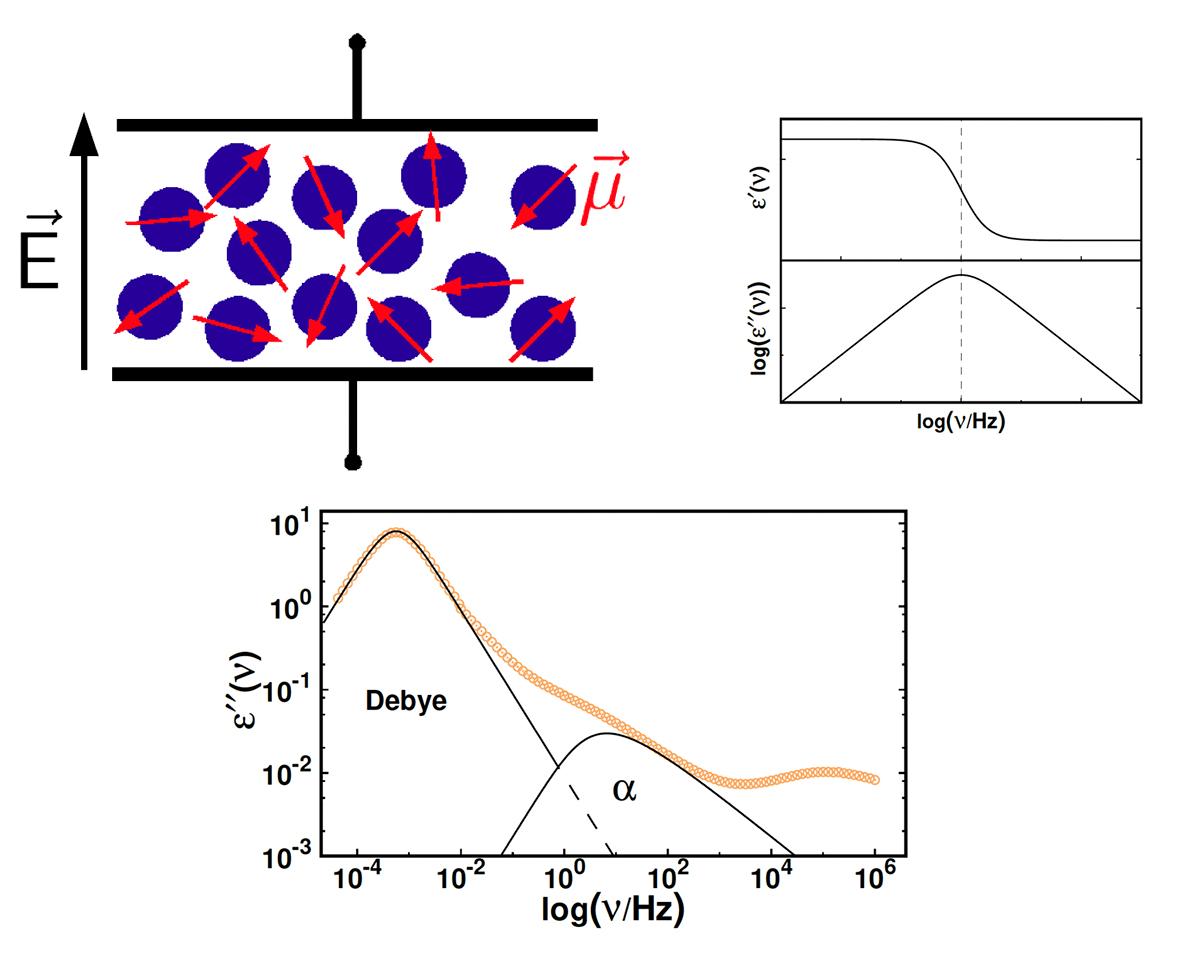
Typically, in experiments an oscillating electric field with frequency ν is applied to the sample and the frequency is varied in the range 10−2 Hz ≤ ν ≤ 107 Hz. This procedure yields the frequency dependent and complex dielectric permittivity ˆε(ν) = ε′(ν) − i ε′′(ν). Here, the real part describes the reversible portion of the permittivity and the imaginary part reflects the loss part. In case the oscillatory frequency of the electric field coincides with the resonance frequency of the molecules inthe sample, one observes a decay in ε′(ν) and a peak in ε′′(ν), as shown in the figure.

In supercooled liquids, BDS allows to identify the different relaxation processes and their respective temperature dependence. E.g. for monohydroxy alcohols, the spectra contain the α-process at moderate frequencies, reflecting the reorientation of single molecules, and a slow Debye process at low frequencies, that can be attributed to the reorientation of supramolecular structures, built via hydrogen bonds.

Additionally, fast relaxation contributions with small amplitudes are observed at high frequencies.In addition to experiments in the frequency range 10−2 Hz ≤ ν ≤ 107 Hz, time-domain experiments((10−6 Hz ≤ ν ≤ 101 Hz)) and high-frequency techniques (108 Hz ≤ ν ≤ 1012 Hz) can be applied. This broadband-character of BDS is particularly valuable, as it allows the characterization of relaxation processes in liquids from temperatures close to the boiling point down to deep into the glass.

Picture: AG Blochowicz

Depolarized dynamic light scattering (DDLS)

DDLS probes the reorientation of molecules in a liquid by analyzing the scattered light. In the scattering event the induced molecular dipole for spherical molecules is parallel to the electric field vector of the incident light.

Two light scattering techniques provide access to molecular diynamics on different time scales. Left: Tandem Fabry Perot Interferometry yields the spectral distribution of the scattered light in the Gigaherz to Teraherz range (i.e. on picoseconds to nanoseconds timescale). Right: Photon Correlation Spectroscopy measures time fluctuations of the scattered light intensity in the range of nanoseconds up to several thousand seconds. Both data can be represented in frequency (susceptibility, bottom left) as well as in time domain (time correlation function, bottom right).

Therefore, incident and scattered light have the same polarization. For arbitrarily shaped molecules this is not the case and the scattered light contains a portion which is polarized perpendicular to the polarization of the incident beam. Investigation of this kind provide information about the reorientation dynamics of the molecules.

One of the DDLS techniques is photon correlation spectroscopy (PCS). In PCS the randomly fluctuating intensity of the scattered light is measured over time and the intensity autocorrelation function is recorded. It has its maximum at t = 0 and decays over time, depending on the dynamics of the molecules. The timescale on which this correlation decay takes place and its precise evolution hold information about the dynamics of the molecules in the sample.

Another DDLS technique is Tandem Fabry Perot Interferometry (TFPI). This method is based on the fact that the dynamics of the molecules in the sample also affects the frequency of the scattered light. The scattering spectrum is therefore broadened compared to the spectrum of the incident light.

A TFPI is a tunable narrow band frequency filter, which consists of two Fabry Perot interferometers (FPI) and measures the frequency dependent intensity out of which the spectral density can be obtained. Out of the spectral density the generalized susceptibility can be calculated, which makes TFPI comparable to other methods like PCS and BDS.

Combination of these methods can be used to cover a large frequency range that reaches from10−6 Hz to 1013 Hz. In contrast to BDS, DDLS can be used to probe molecules that have a very weak or no dipole moment, if they have a large enough optical anisotropy.

Video

Fluctuating speckle pattern of the scattered light due to molecular motions as observed in a photon correlation experiment

Picture: AG Blochowicz

Triplet state solvation dynamics (TSD)

TSD is an optical measurement method that allows access to the local reorientation dynamics of molecules. Dye molecules, which are dissolved in high dilutions in the liquid to be investigated, serve as probes for the molecular dynamics.

In order to measure the local reorientation dynamics of the molecules, the existing equilibrium state in the first solvation shell around the TSD probe (∼ 1 nm) is disturbed. This is realized by exciting the TSD probe by a UV laser pulse. Since the perturbed system is energetically out of equilibrium, the molecules in close proximity to the TSD probe begin to rearrange and change their orientation. This in turn leads to a spectral shift in the phosphorescence spectrum emitted by the dye molecule. The spectral shift thus contains the information about the local reorientation dynamics of the molecules. With the help of the time-resolved measurements of the phosphorescence spectra, the local reorientation dynamics of the molecules is accessible.

If polar dye molecules are used as TSD probes, a local dielectric experiment can be performed in this way, whereas if nonpolar dyes are used, it is a local mechanical experiment.

If polar dye molecules are used as TSD probes, a local dielectric experiment can be performed in this way, whereas if nonpolar dyes are used, it is a local mechanical experiment.

Video

Please see a video of a TSD probe.

Picture: AG Blochowicz

Differential scanning calorimetry (DSC)

DSC is a method for thermal analysis and identification of phase transitions. The method can be used to observe crystallization and melting processes as well as the glass transition.

Physical transformation processes during the experiment can be identified by temperature differences since energy is absorbed or released by the system. For this purpose, the amount of heat is measured that is required to bring the sample and an empty reference pan up to a certain temperature.If a physical transformation takes place in the sample during the measurement, the temperature and the heat flow QP of the sample changes compared to QR in the empty reference pan. Physical transformations can thus be identified on the basis of the measured difference.

In the experiment, temperatures from about 200 °C to -180 °C can be investigated with a fixed heating rate in the range of 5 to 80 K/min. As a function of temperature, a thermogram is recorded in which the physical transformation processes become visible through an abrupt change in the heat flow.

As an example, a schematic thermogram is shown for an amorphous plastic with a glass transition. When the sample is heated, a glass transition (A1) occurs in which the sample changes to the liquid state as the temperature increases. Subsequently, when the sample is further heated cold crystallization occurs (A2) due to crystalline nuclei that have formed at low temperatures. On further heating the crystal melts (A3) and if the temperature is increased further, the sample evaporates(A4). Thus, the measurement technique allows to determine phase transitions in many kinds of materials.

Picture: AG Blochowicz

Quasielastic neutron scattering (QENS)

Quasielastic neutron scattering (QENS) stands out among the experimental techniques to probe molecular dynamics because it provides spatial information besides the dynamic variable.

Thus, in addition to the characteristic timescale of a relaxation process, a length scale is obtained, usually characterized by the scattering vector q. A special feature of QENS is that the wavelength of thermal neutrons (≈ 0.025 eV) is in the range of a few Ångstroms, which is on the order of typical distances between atoms and molecules in condensed matter. Compared to X-rays, which can be at the same wavelength, the energy of neutrons is much smaller, due to their rest mass. Therefore, small energy changes can be resolved more easily. These energy changes occur as a result of a scattering event and give information about relaxation processes in the material under study. In that way energy resolution below Microelectronvolts is routinely achieved. As the energy changes are small, the scattering is called ”quasi-elastic”.

Another peculiarity of QENS is the exceptionally large (incoherent) scattering cross section of hydrogen, compared to other elements and isotopes. This allows on the one hand to monitor ”tagged particle”dynamics in materials that contain hydrogen (which is true for most organic and many inorganic materials). On the other hand a systematic replacement of hydrogen with deuterium(much smaller cross section) allows to make the method insensitive towards certain components and to selectively observe the dynamics of a certain molecular species. As an example the figure shows the relaxation of glycerol molecules inside of 4.8 nm sized microemulsion droplets in the temperature range between 380 – 250 K. For the data set we combined a backscattering and a time-of-flight spectrometer at the ILL in Grenoble, France.

Videos of our measurement techniques

DDLS

Fluctuating speckle pattern of the scattered light due to molecular motions as observed in a photon correlation experiment.

TSD

After excitation with the UV laser pulse, the TSD probe luminesces. In the TSD experiment, the phosphorescence is detected spectrally and time-resolved to obtain information about the local reorientation dynamics of the molecules.